FEMA LIFELINES
Casey Bruns · Adrian Campos · Jacqueline Walker
FEMA – Lifelines
The FEMA Lifelines project comprised of a two-fold goal:
- Estimate and categorize businesses and infrastructure in a city by FEMA Lifelines
- Understand the distribution of FEMA Lifelines
FEMA Lifeline Community Implementation Toolkit
For detailed information concerning the FEMA Lifelines – see the FEMA Toolkit file for details
Approach
Step 1. Research Lifelines
- We split up the research by lifeline, so each of us researched FEMA’s needs and uses for a few at a time. In this research, we found that some of the categories and search terms of Yelp and Google didn’t address components. Finding relevant data was one of the intial struggles. However, once we had the search terms, we were able to pull down the data relatively quickly by using functions.
- We manually selected YELP categories and Google Search Terms that aligned with FEMA’s 7 lifelines and the components within each. We applied our search to Houston, Texas. For this project, we started with YELP and then utilized Google to populate the components that were not available through YELP.
Using Functions:
Step 2. Used lifelinescrape.py to import functions that automate the scraping and place data into a pandas.DataFrame
Type 1. We used the following for our Getting Lifeline Data notebook. Because we initally split up the task of digging into these lifelines over a single city(Houston, TX), these functions below are only for Houston, Texas and is designed to only process one Lifeline at a time.
- scrape_yelp(tuple_list, lifeline_num api_key)
- scrape_google(tuple_list, lifeline_num api_key)
Type 2. We used the following for our Find Your City notebook. After we finished getting all our data, we realized these functions could easily be translated to other cities. To do this, we had to come up with general search terms that could apply beyond Houston, TX and still meet FEMA Lifeline needs. After coming up with this list we were able to modify the function to take in just a city parameter and automatically find all the lifelines. We only used Google in this function because Yelp returned unreliable data regularly, so to avoid this problem we just pulled from GooglePlaces API. One of the drawbacks in using this is that we were only able to figure out how to pull down 20 search results at a time. Going forward, it would be cool to get the code to pull down more than the first page of results.
- find_lifelines(city, api_key)
Results
Some noteworthy findings were:
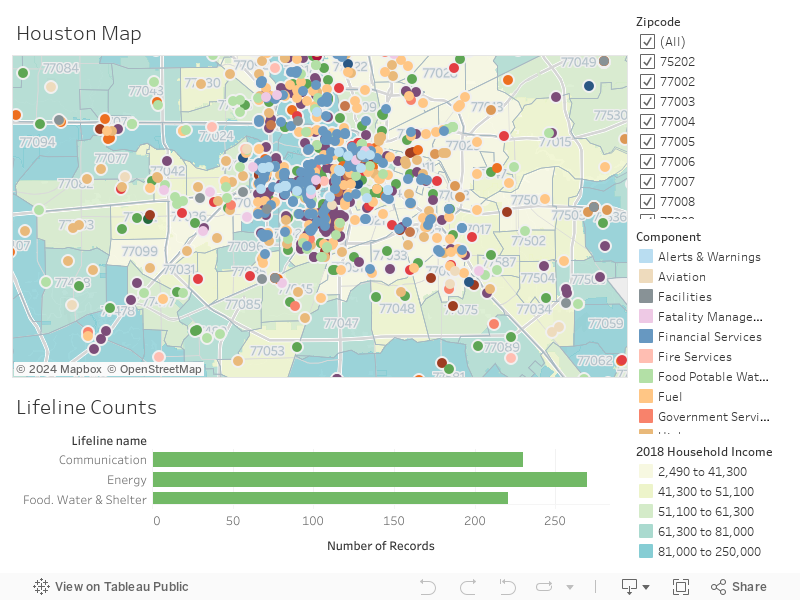
- Energy had the highest return of the 7 components, with 270 total observations
- Hazardous Material had the lowest return of the 7, with 27.
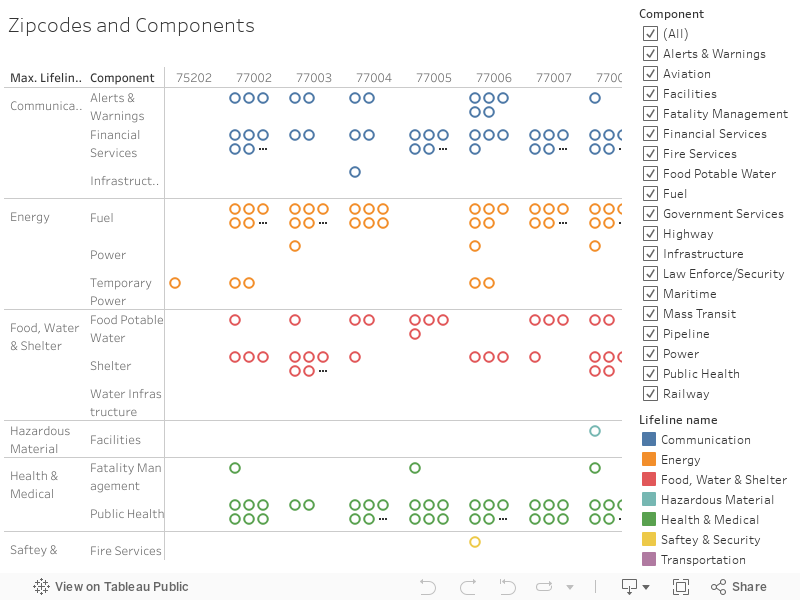
- The 7 lifelines are broken down into a total of 22 components.
- The highest component was public health with 238 observations.
- The lowest component was search and rescue with only 1 observation.
Houston was significantly more lifeline-dense on the west side of the city, with Interstate Highway 45 and Highway 288 providing an East/West Visual Barrier.
There is noticeably less access to financial services in zip codes east of the highway lines. There are also noticeably fewer hospitals and medical centers.
The energy lifeline (consisting primarily of fuel service stations) is more evenly distributed as are Food, Water, & Shelter, and Safety & Security.
For demonstration purposes a temporary one page site was developed and may still be available. This site has interactive maps and zip code data by lifeline & component for Houston. FEMA Lifelines Website.
Tableau Public visualizations should still be available with data from Austin, Atlanta, & Chicago. Visualizations
Improvements & Next Steps
Improvements:
For this project, we started with the YELP and used Google to supplement. In the future, starting with Google to populate as many of the components as possible and then exploring YELP (and researching further to determine what other sources might yield appropriate information) would likely yield more observations and allow us to tell a more complete story.
Additionally, I think more time in the discussion and research of the lifelines and their individual components to ensure our search terms authentically meet the goals of the FEMA lifelines as closely as possible. We spent over two days on this and were intentional in the timeframe, but I believe it could still get better as we learn more over time.
Next Steps:
This model serves as a base and could be used to assist FEMA in the first steps of natural disaster planning. It has not yet reached the point of being of service in the event of a hurricane, our natural disaster of focus.
Learning how to do the following and implementing will help us to support FEMA during and after a hurricane, in addition to before:
- embed live information about if the businesses/locations are open and functional
- train a model on prior hurricanes that have hit Houston (Harvey, Ike), to show at any given time which areas and the lifelines within them will still be functional or will be damaged and to what degree
Authors
FEMA LIFELINES DEMO
During our project presentation, we decided to recreate an actual disaster scenario, where FEMA would need situational awareness going into a disaster area. With this in mind, a live demo was deemed necessary. FEMA would have the ability to select the city in question and have the 7 Lifelines populated along with their corresponding components
Atlanta and Chicago were chosen, we decided to include Austin. As this is a live scraping of assets available at the given moment, the web sources are scraped and dynamically made available to FEMA. Below you will find the finished tableau dashboards with this data.
Feel free to play around with the interactive components. Select your city and Lifeline you would like to explore. You will find the Lifeline location and its corresponding components.